Dashboards
Transcript
The “Dashboards” app is a powerful tool to create dashboards and visualise data.
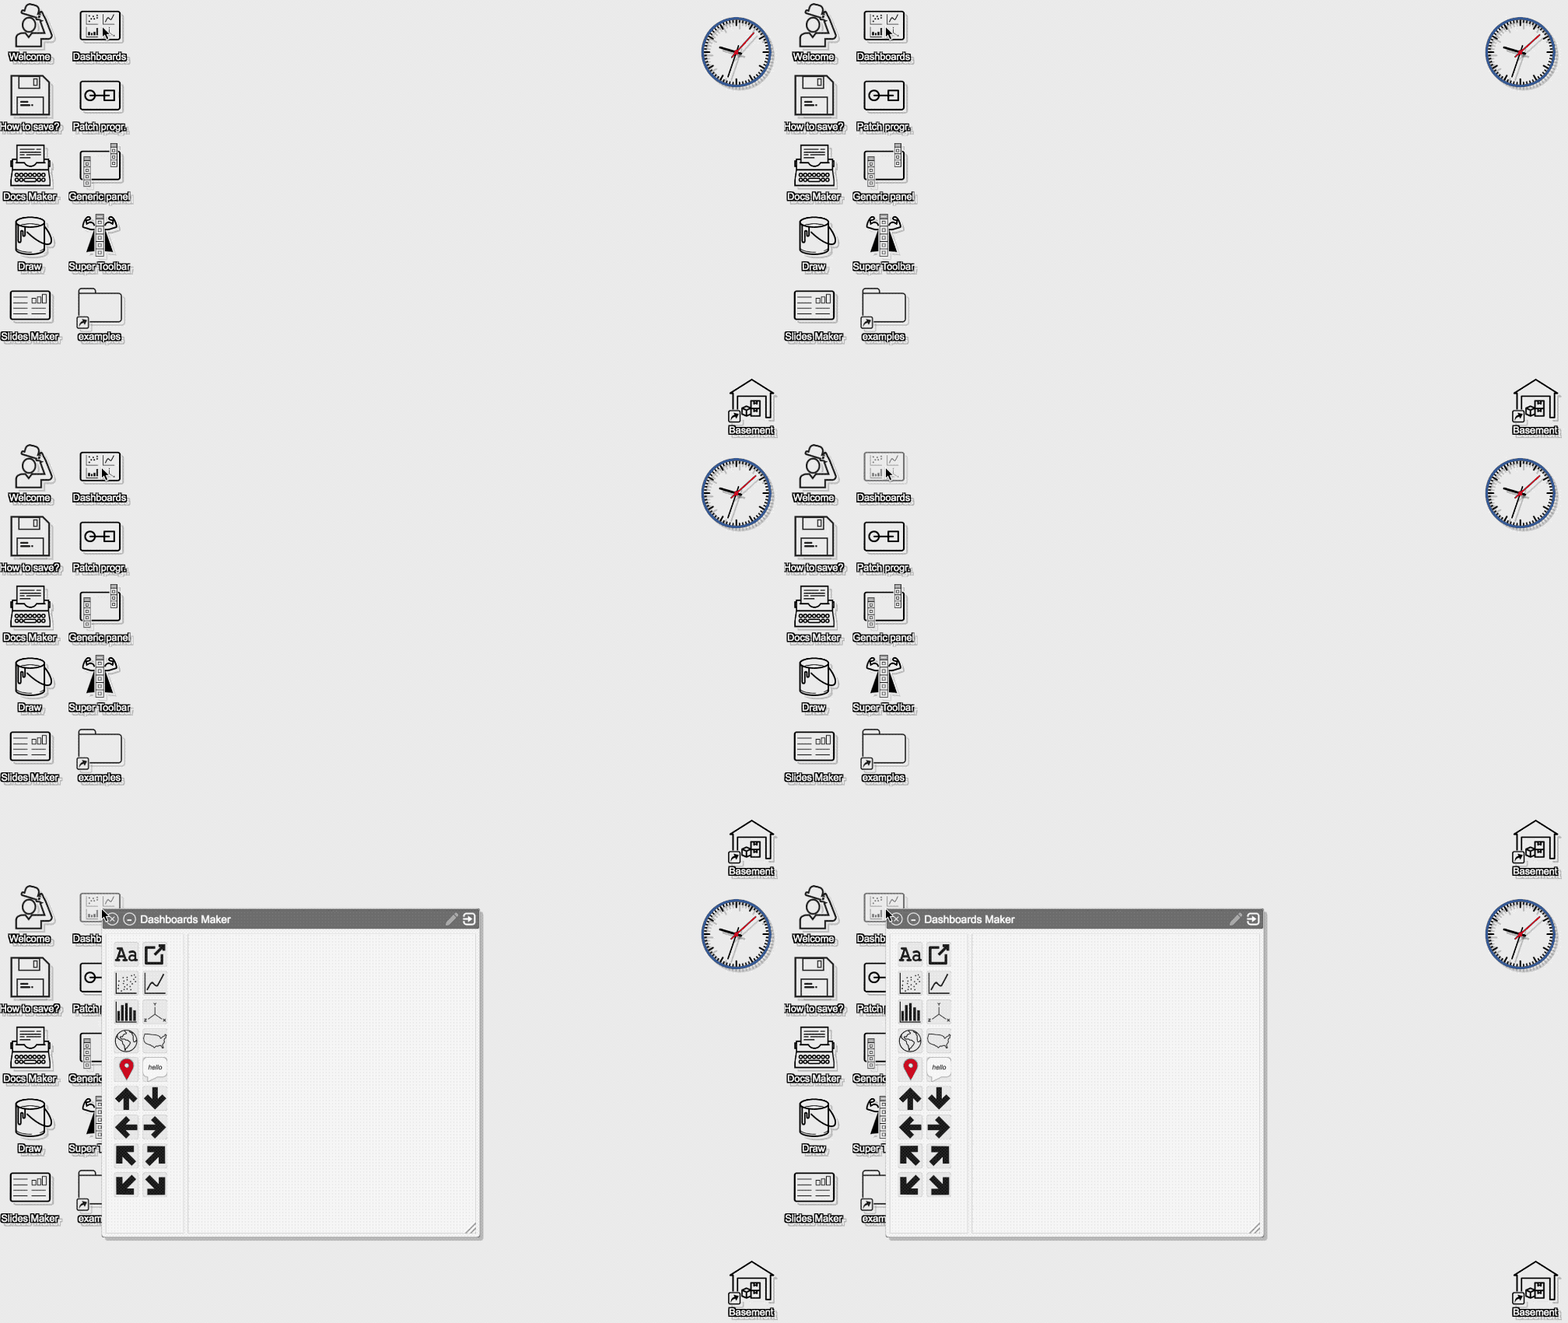
To open it, double click on the Dashboards icon:

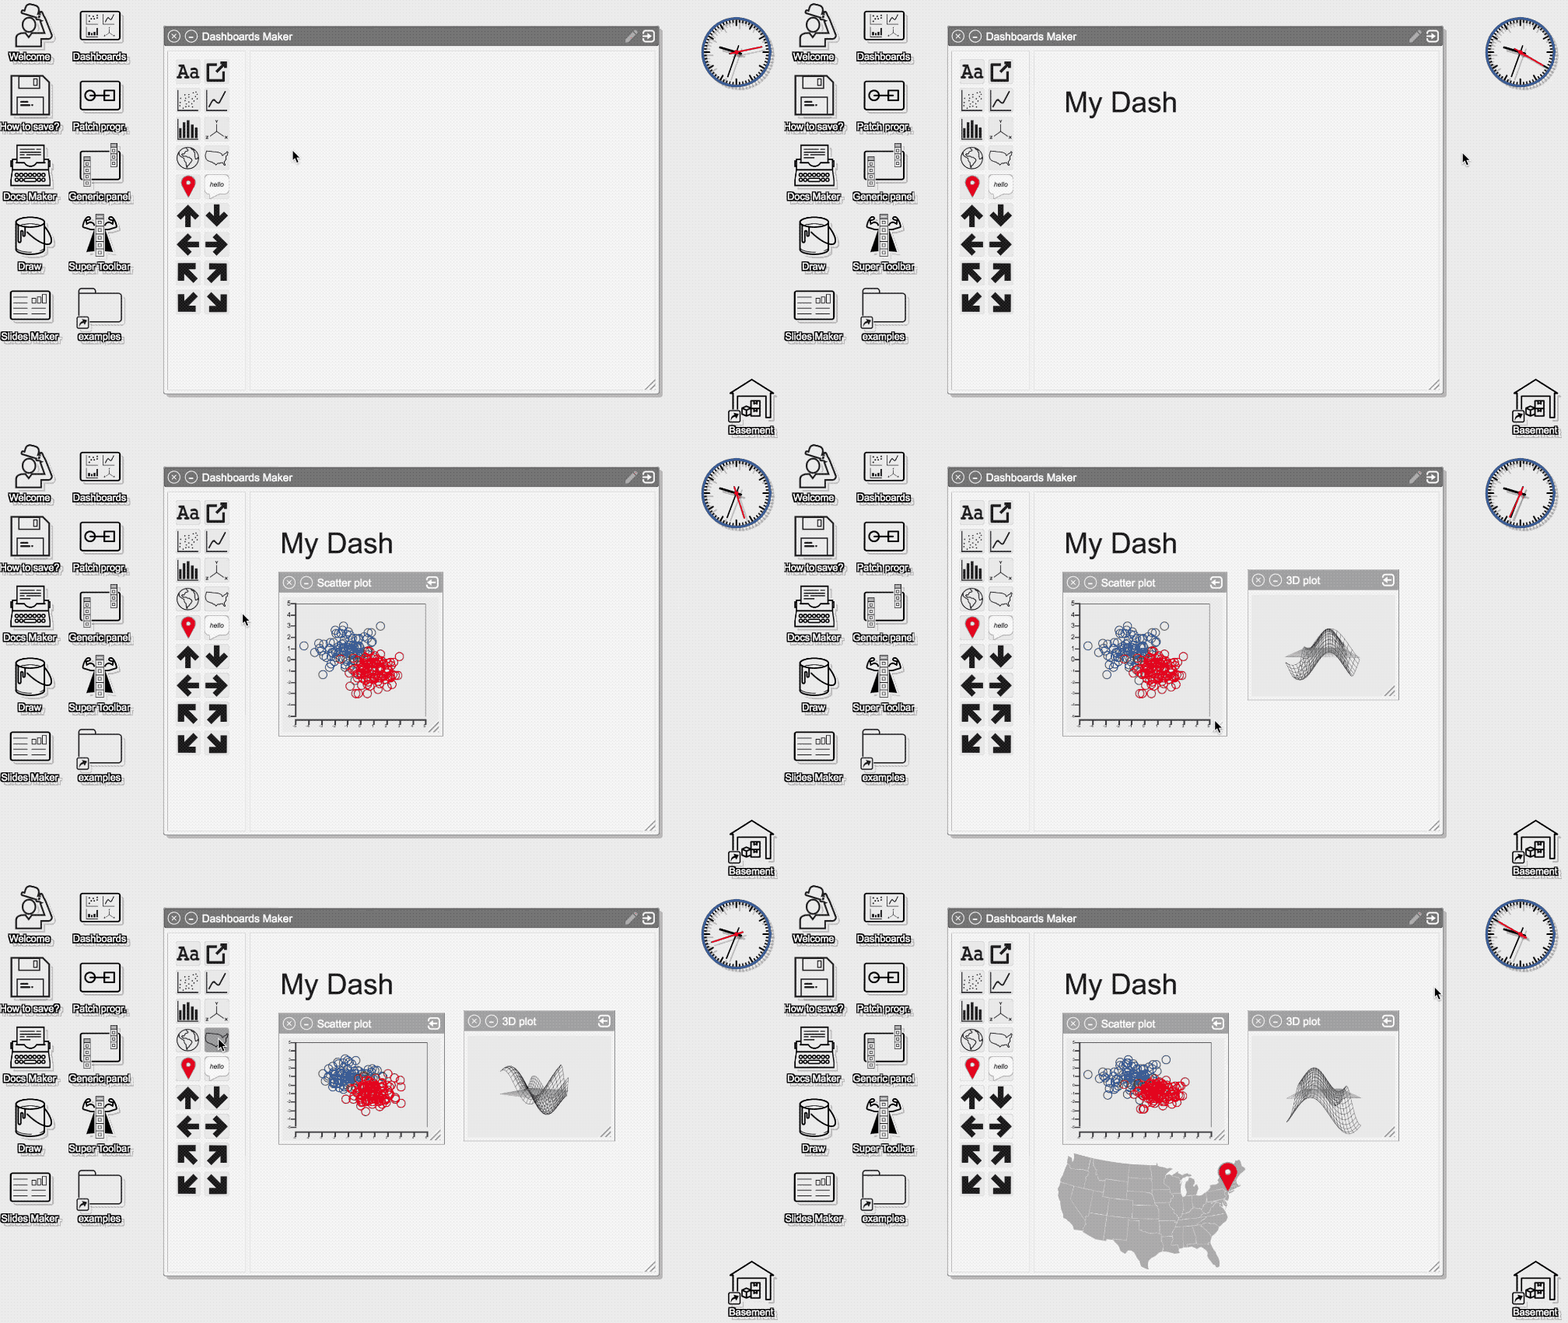
The starting panel has a toolbar and the “editing pencil” is highlighted. When clicked, the toolbar is hidden, for less clutter and easier reading. Just click again to bring up the toolbar, where there are sample graphs that can be dragged out and put in place:

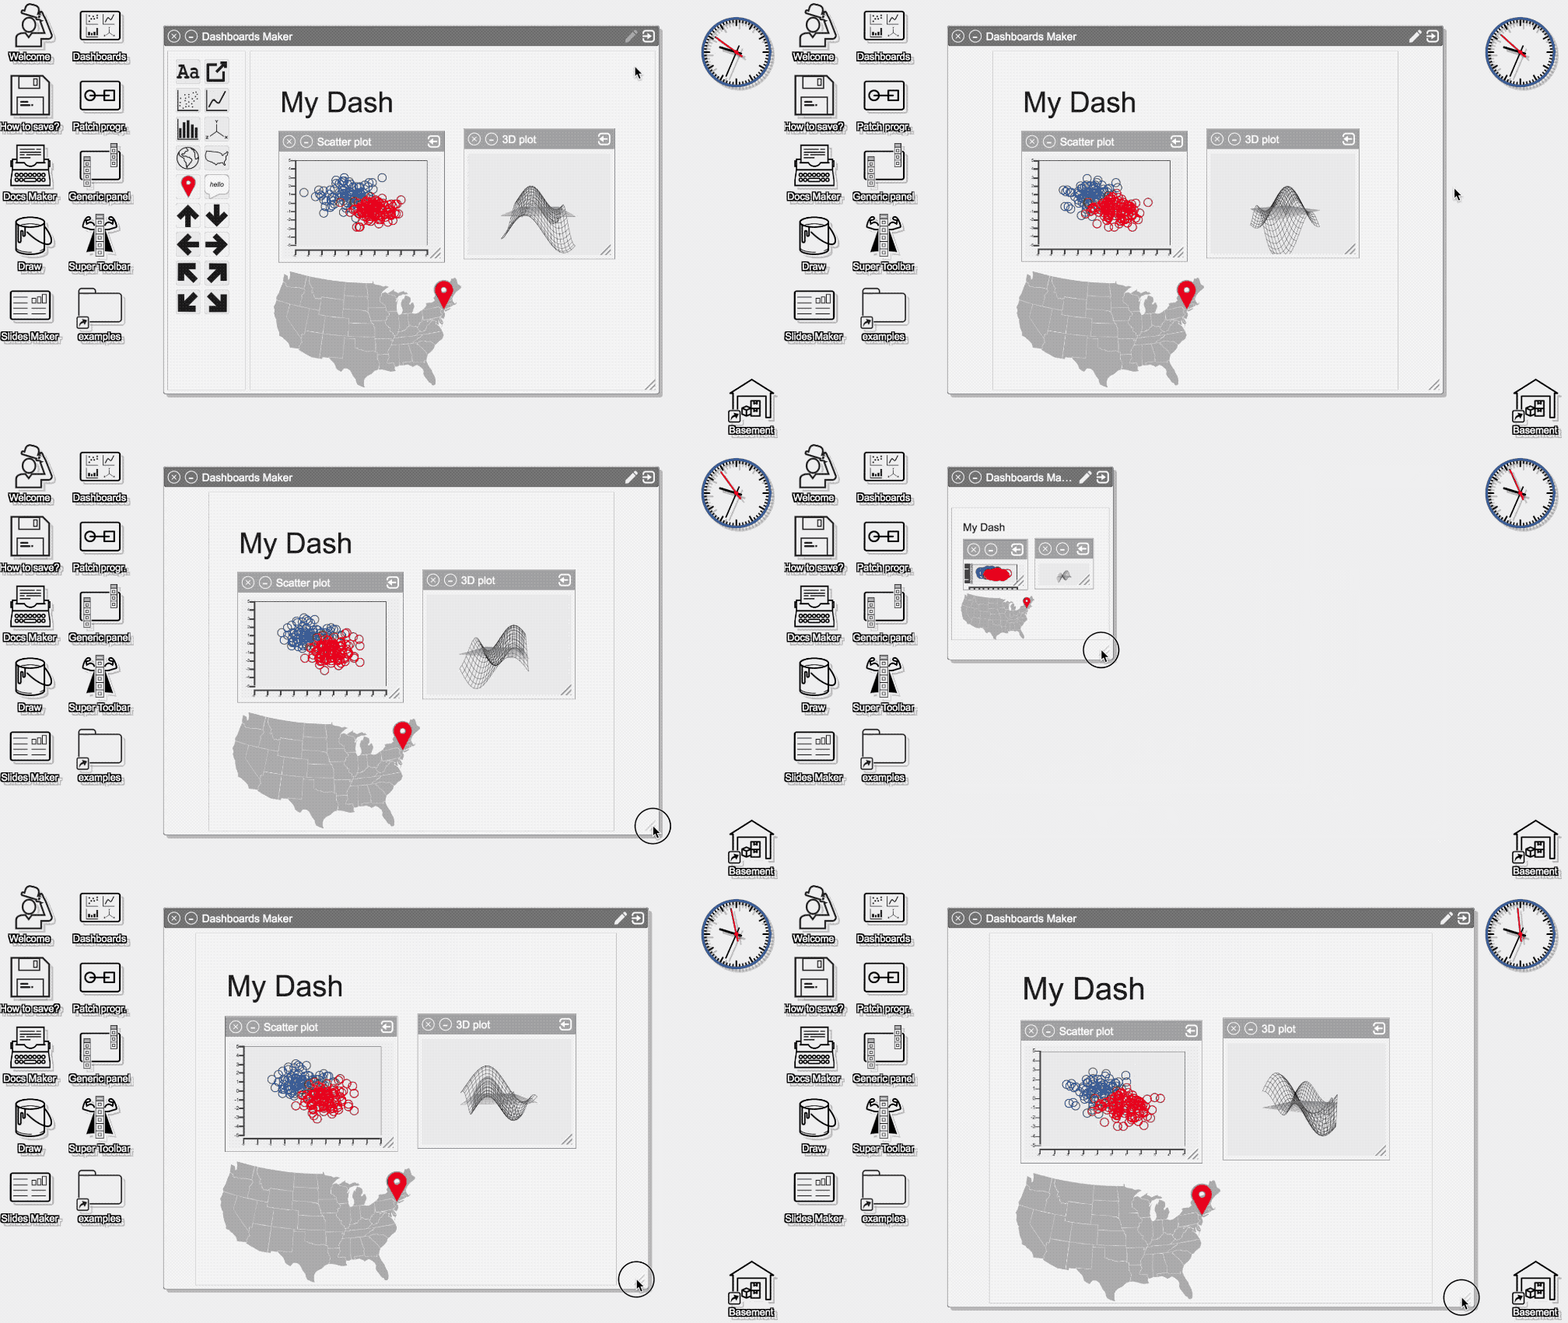
Once any item is added, the Dashboard panel will lock its proportions, so when it’s resized all the items will keep their relative positions:

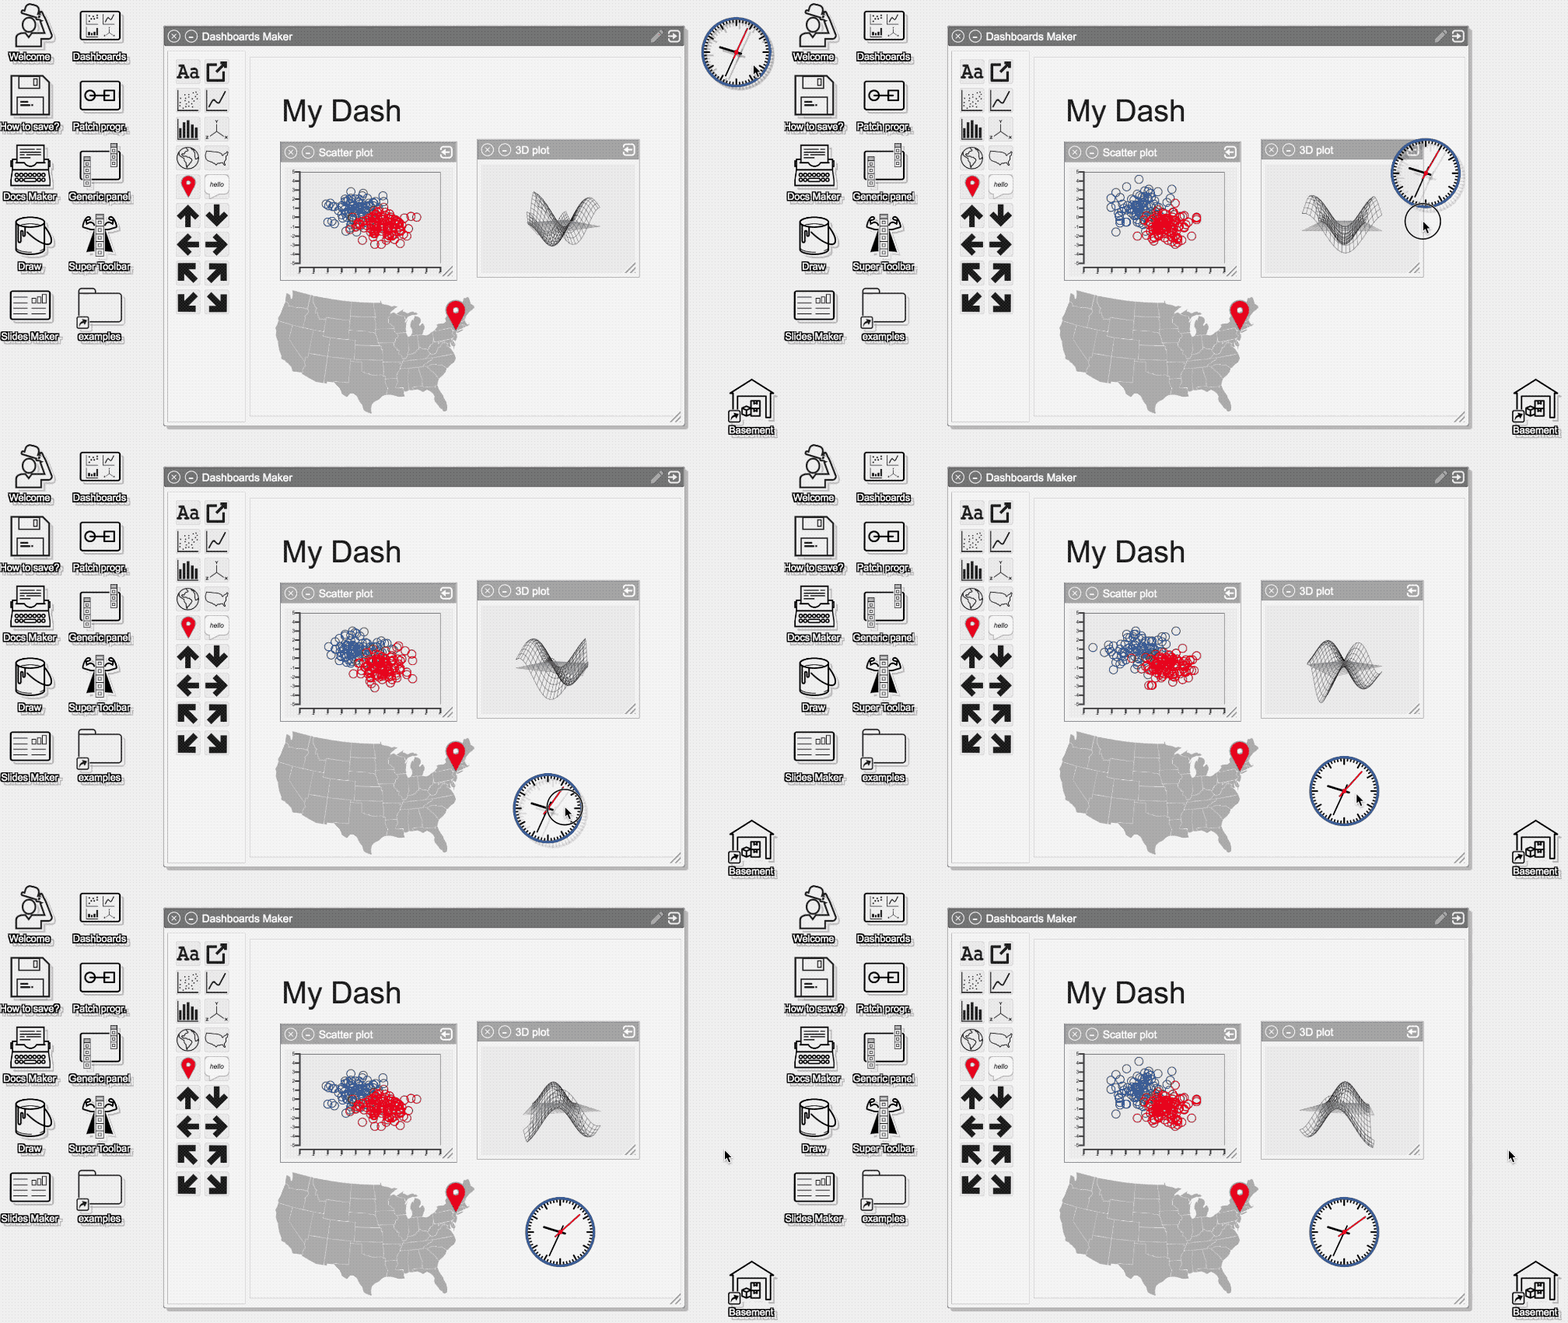
Just like in text documents and slides, anything can be dropped in a Dashboard, try with the clock for example:

That’s it for “Dahsboards”, a powerful tool for data visualisation. Check out the other videos to see more examples of data visualisation.